 camalie networks Wireless Vineyard Monitoring
|
|
| Controlled Stress Irrigation (CSI)Controlled Stress Irrigation is a new irrigation paradigm introduced by Camalie Networks. It is based on the regulated deficit irrigation approach developed at UC-Davis but rather than depend on error prone ET calculations it uses soil moisture and vapor pressure deficit to estimate leaf water potentials continuously. ET calculations are prone to errors in canopy size, local weather conditions and other factors. These errors accumulate over time often leading to a wilting event or excessive irrigation. Real time plant stress based irrigation avoids these cumulative errors. With the real time constant monitoring of water stress possible with the eKo Pro System it is possible to stress the vines closer to the wilt point without reaching it. This enables growing grapes at a higher level of water stress which conserves water and is known to improve wine grape quality. We have observed that our irrigation volumes can be as little as 1/4 of the ET based irrigation volume prescription. In 2005-2009 Camalie Vineyards on Mt. Veeder used just 35-46 gallons per vine each season to irrigate and still achieved a yield of almost 4 tons/acre in 2007 and 2009. Many factors affect yield besides water.Soil moisture measurements at multiple depths and many locations are easily achieved using eKo Pro stations. They each have 4 sensor ports which can accomodate any combination of sensors. The soil moisture tension data taken at different depths using Watermark or Decagon EC-5 sensors provides visibility where your eyes can't see. Correlating leaf water potentials to the soil moisture at different depths provides information about where it is most important to control soil moisture and by implication where the vine roots are. Data from different depths also provides insight into how fast water moves down through the soil which is useful for determining irrigation set durations and intervals. More porous soils need shorter sets more often to avoid having water bypass the root zone or dry out excessively between irrigations. On June 19, 2008 Camalie founder Mark Holler presented a technical poster, High Density Wireless Soil Moisture Monitoring for Deficit Irrigation Management at the ASEV conference in Portland Oregon showing that less labor intensive soil moisture sensing can substitute for manual leaf water potential measurements. A copy of it appears below. High Density, Multiple Depth, Wireless Soil Moisture Tension Measurements for Irrigation ManagementMark Holler, Owner, Vitaculturist, Camalie Vineyards, Napa, California mholler@pacbell.net 650-799-6571 Abstract: When sampled sufficiently at appropriate depths soil moisture tensions were found to correlate well with pressure chamber measurements of midday leaf water potential in Cabernet Sauvignon grape vines. Sampling 2-3 sites per acre across a 4.4 acre hillside vineyard produced a substantial correlation of midday leaf water potentials to soil moisture tensions at 24” depth; R 2=.42. No correlation with soil moisture tension measured at 12” depth was observed. The correlations were performed on soil moisture data and pressure chamber data from the 2007 irrigation season from a 4.4 acre Mt. Veeder hillside vineyard on the western slopes of Napa Valley. Soils in this vineyard are predominantly clay with a gradient of organic materials diffusing across the vineyard from an uphill forest watershed. Soil moisture data from Watermark soil moisture tensiometers placed at 2 depths at 10 monitoring sites was analyzed. The data suggests that soil moisture tension measurements may be able to replace many leaf water potential measurements which are significantly more labor intensive. A strategy for use of soil moisture tension measurements in managing regulated deficit irrigation of grape vines is presented. Monitoring of other irrigation system parameters using the Crossbow Eko-Pro self organizing wireless sensor network employed are described.
IntroductionIrrigation management in agriculture and landscaping is of growing importance as the growing global population puts more demand on finite fresh water supplies. Managing irrigation optimally improves yields, and quality, while reducing water use and pumping energy costs. Optimal irrigation management requires reliable knowledge of plant water stress and soil moisture status. Many different devices and techniques have been used to gather this type of information. [1,2,6] Pressure Chamber measurement of leaf water potential, pressure based tensiometers, neutron probes, electrical resistance based tensiometers,(gypsum blocks, Watermark –granular matrix), and electrical soil dielectric probes( capacitive Echo2 and time domain reflectometry,TDR) are commonly used. These devices offer different trade-offs in ease of use, cost, accuracy, range and precision. Pressure Chamber measurements of leaf or stem water potentials provide the most direct and accurate indication of a plant’s water status but, are time consuming, labor intensive and require an expensive instrument. They provide no information about water transport in the soil. Neutron probes probably give the best measure of soil water content but they use radioactive sources making them hazardous in addition to expensive and labor intensive. Water content measured by a neutron probe is valuable because it is unconfounded by soil parameters or water salinity and because it can measure water content to 100% saturation level. This makes it a good research tool but not necessarily the best tool for production irrigation management. Simple conductivity and capacitance measurements are generally not very useful because they are sensitive to both water content and salinity at the same time making the data difficult to interpret without site specific calibration. Tensiometers measure the water matric potential in the soil which is a measure of how hard the plant must work to draw water from the soil. Soil water tension includes the effect of soil particulate size. Soil with smaller particles has more surface area and thus more surface tension which makes it harder for the plant to extract water from this kind of fine particle clay/silt type soils. Smaller soil particles however, allow the soil to hold more water. Pressure measurement based tensiometers require regular refilling and degassing after a dry period. In addition they have a maximum range of –80cB limited by the vapor pressure of water which is significantly below the range where many drought tolerant plants like grape vines grow. In contrast resistive soil moisture tensiometers like the Watermark Soil Moisture Sensor[9] require no field maintenance and are responsive to soil tensions in excess of -200cB. Other desirable properties of the Watermark sensor are its low cost ($35), longevity (years) and the minimal power required to sense its physical state. Application of a sensing current of a few tenths of a milliamp for a few milliseconds while the voltage is measured is sufficient to interrogate these devices. This low power sensing makes them compatible with small solar powered wireless transceivers which can transport the data sampled every few minutes to where it is most useful in real time. Water transport in soil is often highly variable [6] which results in a high variance in soil moisture data acquired from sensors in situ. Soil moisture sensors are sensitive to soil moisture in only a small volume of soil around the sensor. As such they are sensitive to variations in soil continuity such as cracks, placement of the sensors relative to the dripper and where roots may grow relative to the sensor. When variance is high it is necessary to sample soil moistures at high spatial frequency to acquire enough data to make irrigation decisions with a desired confidence level. [13] It is difficult to know the variance of soil moisture in a field apriori, however, it is fairly straightforward to place a limited set of sensors, assess the data variance and then scale the network up to more locations as necessary provided the acquisition technology scales to more locations easily. This paper reports the application of such a scalable soil moisture acquisition system to irrigation management. It reduces labor costs and presents more data in a more timely and integrated way to the irrigation manager. This new tool is wireless self organizing mesh networking [4-5] which provides data transport between sensors in the field and the irrigation manager on the internet. It essentially extends the internet to sensors embedded in the environment and transforms their physical status to points on a graph within an internet browser. Other desirable properties of this technology are that it is solar powered, inexpensive, scalable to many nodes and long distances and requires no network configuration. The self organizing networking algorithm embedded in the network nodes manages data packet routing and determines the optimal rf paths through the mesh of nodes in the field. Packets are passed from one node to another as necessary to enable the network to cover larger areas without increasing the signal strength of individual nodes. Self organizing mesh networking technology has become sufficiently low cost to enable gathering enough soil moisture data from highly variable sites to make irrigation decisions with adequate confidence for the first time. Real time, web accessible soil moisture measurements also provide remote confirmation of irrigation system operation. Monitoring of water sources and irrigation system pressures and flow rates are used to identify system problems and enable rationing of limited water resources. Benefits are improved grape quality and yields, while reducing water consumption, pumping energy, labor costs and time to repair. The correlation results presented here indicate that soil moisture data can be used to augment or substitute for the much more labor intensive pressure chamber measurements commonly used in deficit irrigation management of grape vines. Soil moisture measurements at multiple depths provide insight into water transport downward in the soil which is useful for optimizing irrigation times and intervals between irrigations. Conditions and MethodologyVineyard The vineyard in which the data was gathered is a 4.4 acre hillside vineyard located at 1000 ft. elevation in the Mt. Veeder appellation on the western slopes of Napa valley [10]. Figure 1 shows the vineyard and how it is divided up into irrigation blocks. Two of the blocks can be further divided into a pair of sub-blocks by manually opening or closing valves in the field. The vineyard is 92% Cabernet Sauvignon French clones, 337,338 and 191. Four percent is Merlot and 4% Carmenere. All of the soil moisture sensors are placed in the root zones of Cabernet Sauvignon vines except for 511 which is in the block of Merlot vines. Root stocks present in the vineyard are 3309, 110R and 101-14. See [12] for a detailed map of cultivar locations. The vineyard was replanted with 4000 green growing vines in March of 2003 except for a third of block 2(blue) which still has 200 vines that are now 32 years old. Vine spacings in the North most block are 7’x4.5’, 7’x7’ in the next block south and 10’ x 4.5’ in the lower two blocks. The 2007 growing season was the second year of production for this vineyard. Yield in 2007 more than doubled to 3.97 tons/acre from 1.81 tons/acre in 2006. The vineyard produced a yield of .9 tons/acre in 2005 when the vines were 2 ½ years old. The 2007 yield is an all time record for this vineyard and high relative to most vineyards on Mt. Veeder. Grape quality was generally good but early rains just before harvest in mid October reduced sugar levels about 2 points after they peaked at 26.5-28 Brix on 10/13/07. Block 1 (northmost) was harvested 10 days later at 28 Brix.
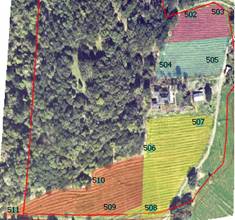
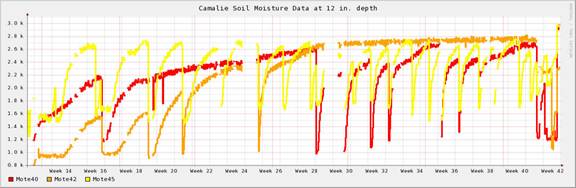
Figure 1 Camalie Vineyards irrigation blocks and soil moisture sensor placements. North is toward the top of this map. The image was colored to show the irrigation blocks. Soils According to the Napa County soil survey the vineyard is located in a region of Bressa-Dibble complex. This complex consists of 70% Bressa soils, 20% Dibble soils and 10% Maymen, Contra Costa, Lodo, Millsholm and Sobrante soils. They are formed in material weathered from sandstone and shale. Vineyard slopes are 0-20% facing toward the South. West and uphill of the vineyard is a forest watershed which provides runoff to the vineyard which transports organic material from decomposing leaves and wood. This runoff from the west and north borders of the vineyard produces a gradient of nutrients across the vineyard. Soil pits dug in 5 locations indicate that the soil texture subsurface is clay at 3 sites, silt at location 504 and clay loam between nodes 505 and 511. There is a swale which collects water in the winter between locations 506 and 509. Rust mottles associated with decomposition of organic matter under anaerobic conditions were observed in this area. Surface texture was clay loam at all sites. Irrigation Paradigm The irrigation strategy used in this vineyard is based on regulated deficit irrigation as described in [1,2]. In this approach the vines are not irrigated at all until their midday leaf water potential reaches a threshold, in this case –13 Bar. After this threshold is reached water is applied at some fraction of the calculated evapo-transporation, typically 50% or 75% with leaf water potential monitored periodically to insure that the irrigations are producing the desired stress level. In this vineyard the approach was modified to maintain constant soil moisture after the threshold was reached rather than to apply water according to calculated ET from weather data and crop coefficients. The availability of real time soil moisture data made this approach possible. Occasional checks of leaf water potential were made to insure that the vine stress levels were not drifting from the threshold value. These measurements comprise the data correlations presented in this paper. Irrigation in 2007 totaled 34 gallons/vine, reduced 26% from the 46 gallons/vine applied in 2006 including water used in fertigation early season and post harvest. Rainfall before the 2007 season was 16” compared to 40” for the 2006 season and the norm for this location. The 2007 season was sufficiently dry that water had to be trucked to the site to supply the last 20% of the water used during the season. Soil Moisture Sensing Soil Moisture data was gathered during the 2007 growing season using an early prototype Crossbow eKo Pro series self organizing wireless sensor network [7]. Ten nodes were deployed at the locations shown in Figure 1 to sample soil moisture at two depths per location once every 10 minutes. Data was transported by the network to a base station where it was stored in a database and made available on the internet via satellite within 1 minute of measurement. Watermark granular matrix soil moisture tensionmeters [9] were placed at 12 and 24 inch depths. Sensors were implanted in the soil according to the manufacturer’s recommendations [8]. A 24 in. deep hole, 1.25 in. diameter, was drilled into the root zone of the vine to be monitored. The deep sensor was placed and backfilled with a slurry of the soil extracted from the hole to minimize disturbance of the soil and roots. Extracted soil was then filled into the hole and compacted up to a depth of 12” at which point the second sensor was placed along with the outflow of a 5mm tube connected to a dripper connected to the above ground irrigation distribution system. A soil temperature sensor was placed adjacent to this upper sensor for temperature correction of the soil moisture measurements. The hole was then backfilled and compacted up to the surface with soil from the hole. Sensors were placed in March of 2006 and were in place for an entire year including a rainy season before the data reported here was acquired. Figure 2 shows a plot of the soil moisture data for the 2007 growing season from 3 sensors at 12” depth in the southwest most block of the vineyard. All data is online at [10].
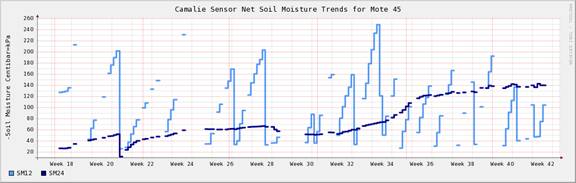
Figure 2 Above is an example Soil Moisture data trend plot for the 2007 growing season. Data from locations 509, 511 and 510 at 12” depth. Data is raw voltage from the measurement circuit in millivolts . Higher = dryer. Irrigation events are low going transients. Below is a plot of soil moisture tensions at 12” depth – light blue and 24” depth –dark blue for location 510. |
|
Send mail to
mholler@pacbell.net with
questions or comments about this web site. |